Uruguayan Elections
 Graphs made by the author
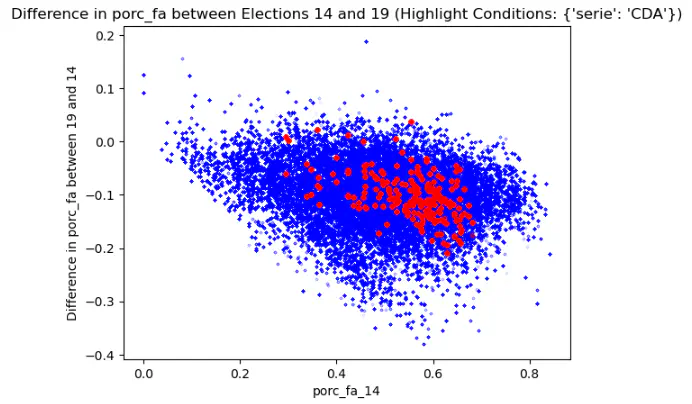
This repository contains a collection of interactive applications and Jupyter Notebooks designed to explore and analyze Uruguay’s electoral data from 2004 through 2024. By leveraging Uruguay’s unique voter ID system and precinct-level data, I built interactive apps that let anyone explore how voting preferences have changed (or stayed consistent) from 2004 onward—across different age groups, neighborhoods, and more. This work also led to a collaboration with Semanario Busqueda, where the tools and data were featured.